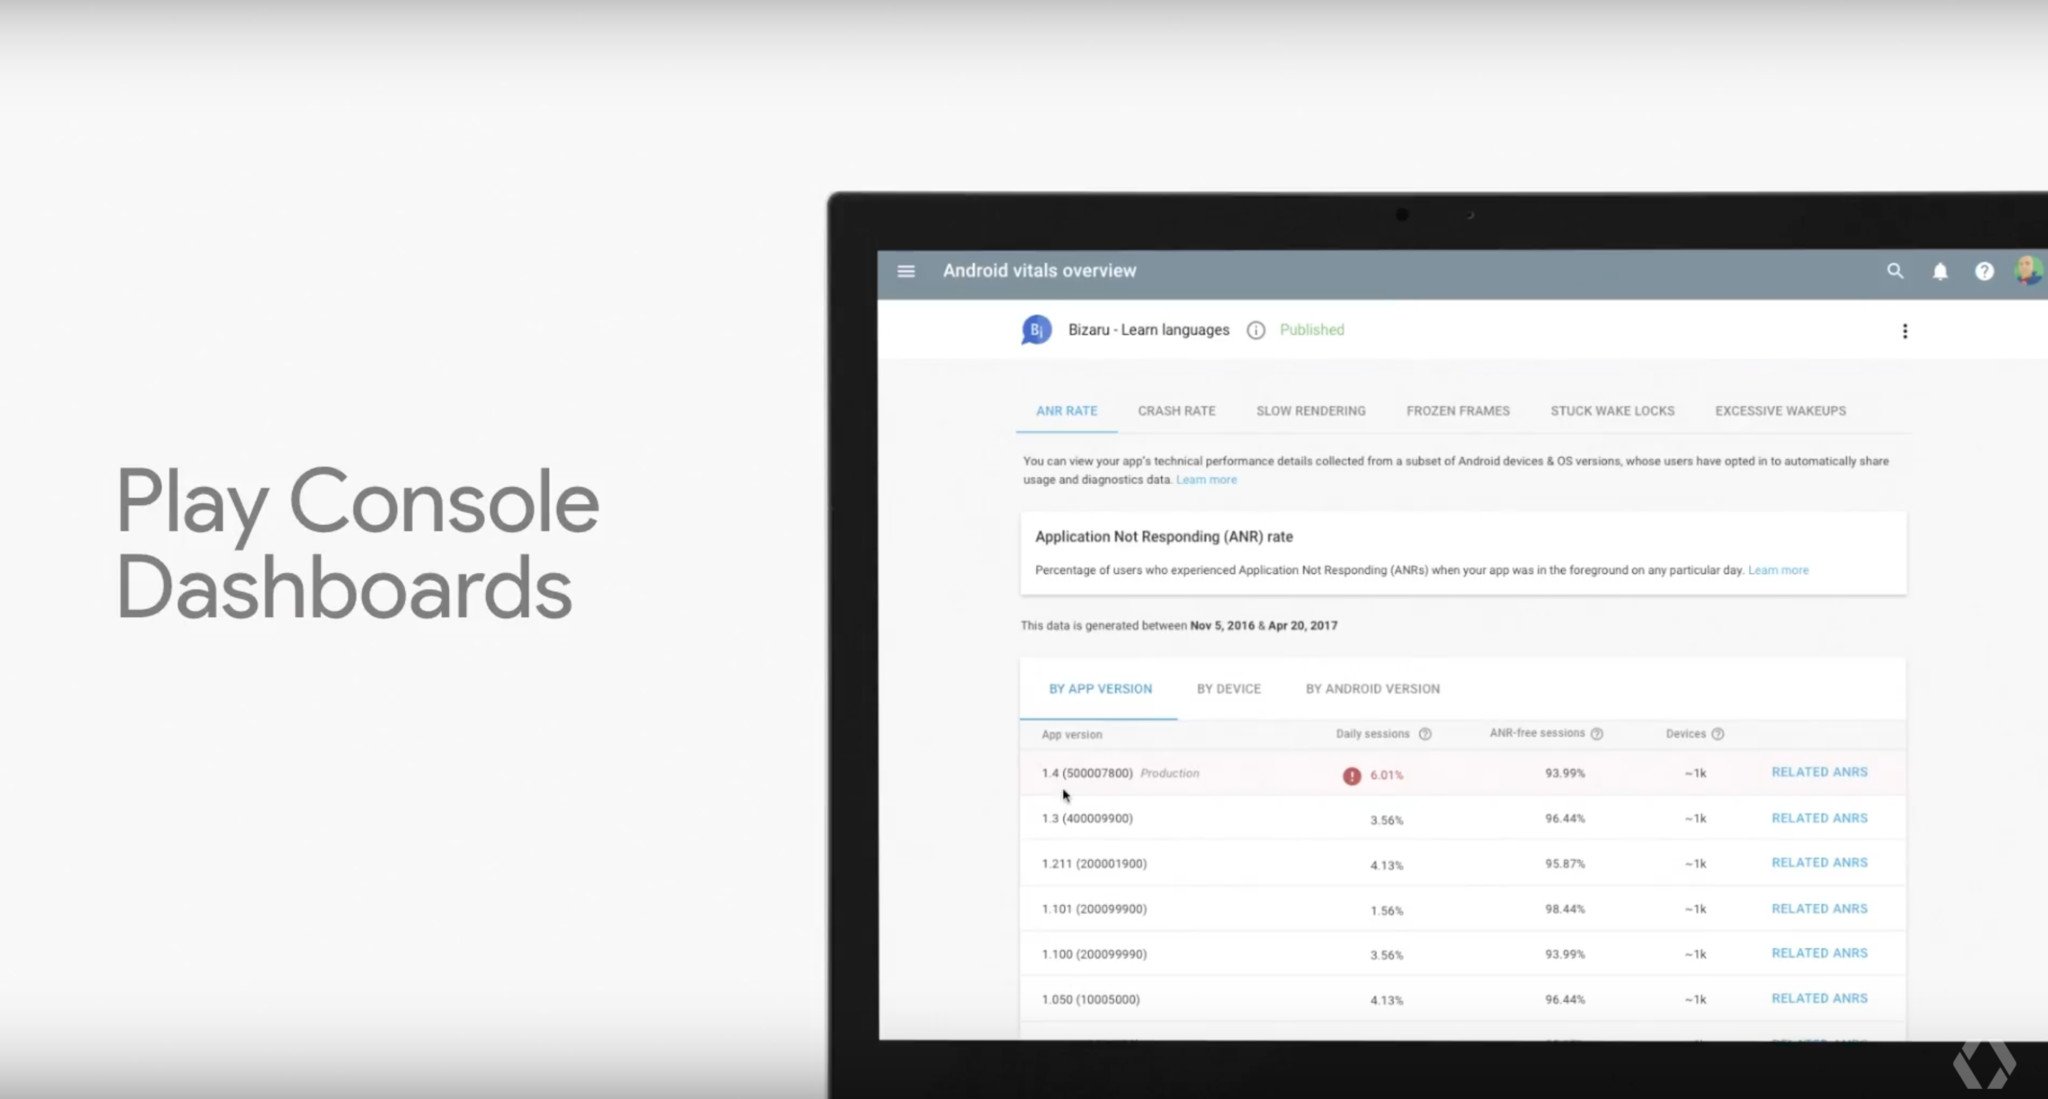
Google's Play Console Dashboards help developers pinpoint problems with their apps

Google is helping developers get a better grip on problems with their apps thanks to new Play Console Dashboards. Launched on stage at Google I/O 2017, Play Console Dashboards essentially provide developers with the vital signs of their apps, helping to pinpoint problems with specific analytics.
Play Console Dashboards pinpoint six issues that cause battery drain, crashes, and slow UI, Google says. Those include ANR rate, crash rate, slow rendering, frozen frames, stuck wake locks, and excessive wakeups. The dashboards also report how many users are seeing each issue with each app version, making it easier to drill down into specific problems.
Also worth noting are new unified profiling tools in Android Studio that can visualize CPU and memory usage over time, drill down into threads and call stacks, and more on a unified timeline.
We'll likely learn much more about these new tools as I/O wears on, but be sure to check out our list of the most important announcements from Google I/O 2017 for more.
Be an expert in 5 minutes
Get the latest news from Android Central, your trusted companion in the world of Android

